Cloud Logging: ACE Exam Study Guide (2026)
Image source: Google Cloud Documentation
1. Cloud Logging Overview
Cloud Logging is a fully managed service that allows you to store, search, analyze, and alert on log data and events from Google Cloud.
1.1. Key Characteristics
- Unified: Collects logs from all GCP services (Compute Engine, GKE, Cloud Run, etc.) and even multi-cloud/on-premises sources.
- Integrated: Works seamlessly with Cloud Monitoring and Cloud Error Reporting.
- Retention: Logs are kept for a specific period (standard is 30 days) and then automatically deleted.
1.2. Log Entry Structure
Each log entry contains:
| Field | Description |
|---|---|
| Timestamp | When the event occurred |
| Severity | Log level (DEBUG, INFO, WARNING, ERROR, CRITICAL, etc.) |
| Resource | The GCP resource that generated the log |
| Log Name | Source of the log |
| Labels | Key-value pairs for metadata |
| TextPayload/JSONPayload | The actual log message |
1.3. Severity Levels
DEBUG < INFO < NOTICE < WARNING < ERROR < CRITICAL < ALERT < EMERGENCY
1.4. Log Router Flow
Log Sources (GKE, Cloud Run, VM, etc.)
         ↓
    Log Router
    (applies inclusion/exclusion filters)
         ↓
    ┌────┴────┐
    ↓         ↓
Storage    Sinks
(30 days)  (export)
1.5. Console Location
View logs in Cloud Console: Cloud Console → Logging → Logs Explorer
2. Log Buckets and Log Analytics
Logs are stored in Log Buckets (not Cloud Storage buckets).
- Default Buckets:
- _Default: For all standard logs (e.g., App Engine, Cloud Functions).
- _Required: For essential logs like Audit Logs (cannot be disabled or deleted).
- Log Analytics (2026 Update): A feature that allows you to perform SQL-based analysis directly on your logs in a log bucket without exporting them to BigQuery.
3. Log Sinks (Exporting Logs)
Log Sinks allow you to export specific logs to other destinations for long-term storage or analysis.
3.1 Log Router and Flow
Logs first pass through the Log Router, which:
- Routes logs to appropriate destinations
- Can apply inclusion and exclusion filters
- Determines which logs go to storage vs. exported
3.2. Sink Destinations (Critical for Exam)
| Destination | Best For | Retention |
|---|---|---|
| Cloud Storage | Long-term archival (years) | As long as you want |
| BigQuery | SQL-based analytical queries | Configurable |
| Pub/Sub | Real-time streaming to third-party tools | Depends on topic settings |
| Another Log Bucket | Cross-project log routing | Per bucket settings |
- Filters: You use the Logging Query Language (LQL) to define which logs should be exported.
3.3. LQL (Logging Query Language) Examples
# All error logs from a specific service
resource.type="cloud_run_revision" AND severity>=ERROR

# Logs from Compute Engine with specific resource
resource.type="gce_instance" AND resource.zone="us-east1-b"

# HTTP requests with latency over 1 second
resource.type="cloud_run_revision" AND
"latency" AND latency>1000

# Export filter: Only errors from production
severity>=ERROR AND resource.labels.service_name="production"
4. Log-based Metrics
Log-based Metrics allow you to create numerical metrics based on the content of your logs.
- Counter Metrics: Count the number of log entries that match a specific filter.
- Distribution Metrics: Extract numeric values from log entries (e.g., latency percentiles).
- Alerting: You can create Alerting Policies in Cloud Monitoring based on these metrics.
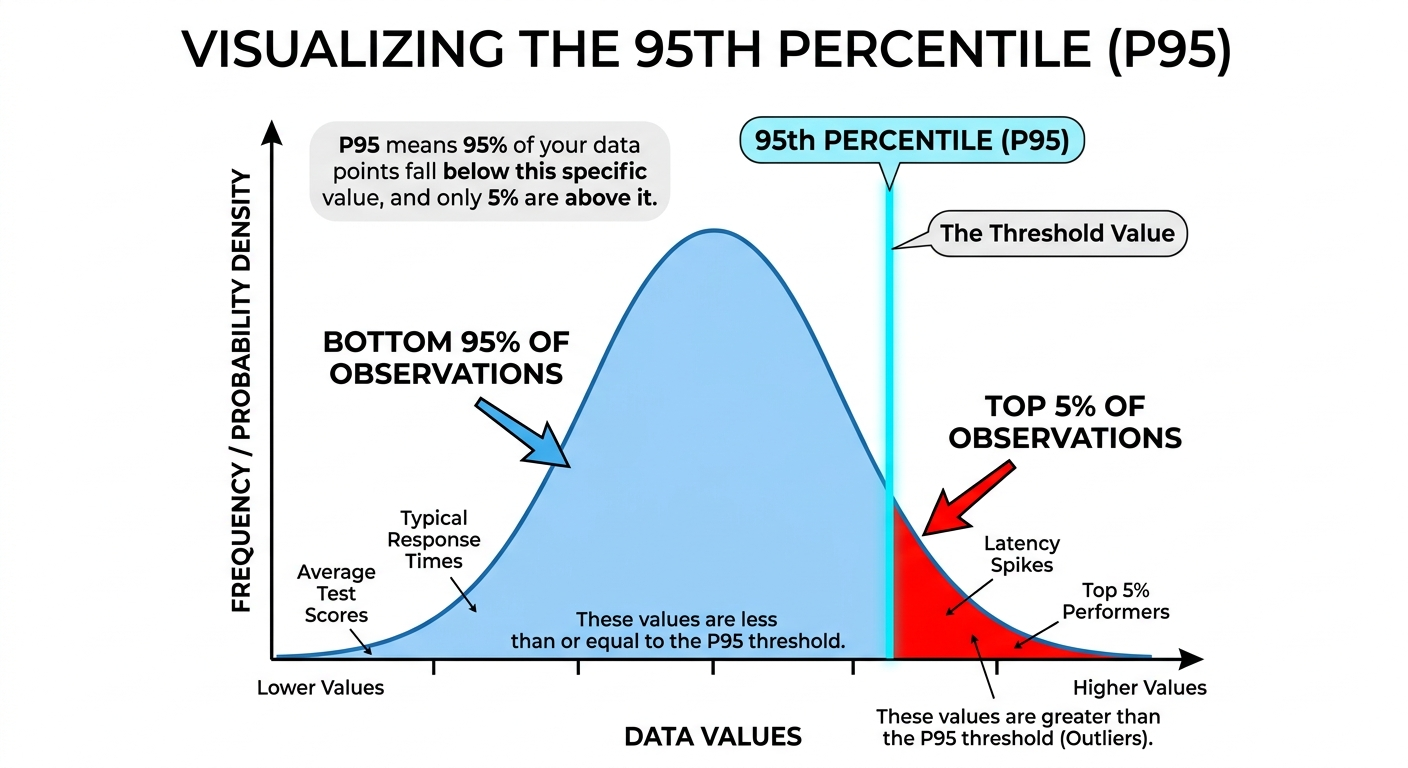
A percentile is a statistical measure used to indicate the relative standing of a value within a dataset. It represents the value below which a specific percentage of data points in a group fall.
Key Characteristics
- Range: Percentiles range from 1 to 99.
- Interpretation: If a value is in the k-th percentile, it is greater than or equal to k% of the other values in the set.
- Purpose: They are used to understand “typical” vs. “outlier” behavior without being as heavily skewed by extreme values as an average (mean).
Common Benchmarks
- 25th Percentile (Q1): The “Lower Quartile”—25% of the data falls below this point.
- 50th Percentile (Median): The middle of the dataset—50% of the data falls below this point.
- 75th Percentile (Q3): The “Upper Quartile”—75% of the data falls below this point.
- 90th/95th/99th Percentiles: Often used in performance monitoring (e.g., latency) to understand the experience of the “worst-case” users.
Practical Example If your exam score is in the 95th percentile, you scored better than 95% of the people who took the test. It does not mean you got 95% of the questions correct; it only describes your rank relative to others.
Image source: Own work.
4.1. Creating Log-based Metrics
# Counter Metric: Count HTTP 500 errors
metric.type="logging.googleapis.com/user/httperror_count"
filter: httpRequest.status >= 500

# Distribution Metric: Extract request latency
metric.type="logging.googleapis.com/user/request_latency"
filter: httpRequest.latency
valueExtractor: regex_extract(httpRequest.latency, "(\d+)s", 1)
4.2. Use Cases
| Metric Type | Example |
|---|---|
| Counter | Count of 500 errors, failed logins, API failures |
| Distribution | Request latency, response size, processing time |
Log-based metrics appear in Cloud Monitoring alongside system metrics and can trigger alerts.
5. Audit Logs
These are critical for security and compliance.
| Type | Description | Enabled | Retention | Cost |
|---|---|---|---|---|
| Admin Activity | Configuration changes (create, update, delete resources) | Always ON | 400 days | Free |
| Data Access | Reading/writing user data (storage, databases) | Manual | 30 days | Paid |
| System Event | Google-managed actions (maintenance, autoscaling) | Always ON | 400 days | Free |
| Policy Denied | Security policy denials | Always ON | 400 days | Free |
5.1. Key Points
- Admin Activity: Records are stored for 400 days. This is fixed, automatic, and free — you cannot shorten or disable it.
- Data Access: Must be manually enabled per GCP service. Creates significant log volume.
- View Audit Logs: Cloud Console → IAM & Admin → Audit Logs
5.2. Viewing Audit Logs
# View admin activity logs
gcloud logging read "logName:\"admin.googleapis.com/activity\""

# View policy denied logs
gcloud logging read "logName:\"policy.googleapis.com/policy_activity\""
6. Access Control (IAM)
roles/logging.admin: Full control over all logging resources.roles/logging.configWriter: Permission to create sinks and log buckets.roles/logging.viewer: Permission to view logs in the Logs Explorer.roles/logging.privateLogViewer: Permission to view logs containing sensitive information.
7. Essential gcloud Commands
- Read Logs:
gcloud logging read "resource.type=gce_instance" - Create a Sink:
gcloud logging sinks create [SINK_NAME] storage.googleapis.com/[BUCKET_NAME] --log-filter="severity>=ERROR" - List Sinks:
gcloud logging sinks list - Delete Logs:
gcloud logging logs delete [LOG_NAME] - Write Log Entry:
gcloud logging write [LOG_NAME] "Log message" --severity=ERROR
7.1. Retention Details
| Log Type | Default Retention | Configurable |
|---|---|---|
| Standard Logs | 30 days | Yes (1-3650 days per bucket) |
| Admin Activity | 400 days | No (fixed) |
| System Event | 400 days | No (fixed) |
| Cloud Storage Archival | Unlimited | As long as you pay |
7.2. Supported Environments
| Environment | How Logs Are Collected |
|---|---|
| Compute Engine | Cloud Logging agent (Ops Agent) |
| GKE | Cloud Logging addon (Fluent Bit) |
| Cloud Run | Automatic via stdout/stderr |
| Cloud Functions | Automatic via stdout/stderr |
| App Engine | Automatic for managed runtimes |
| On-premises/AWS/Azure | Cloud Logging agent |
8. Exam Tips
- Export Choices:
- Archiving → Cloud Storage
- SQL Analysis → BigQuery or Log Analytics
- Real-time → Pub/Sub
- Retention vs. Sink: Remember that logs in the Logs Explorer have a retention period.
- Admin Activity Audit Logs: Always on, free, 400 days retention - you CANNOT disable these.
- Data Access Audit Logs: Must be enabled manually - generates significant volume.
- Log Buckets ≠ Cloud Storage Buckets: Log Buckets are for live log storage; Cloud Storage is for archival exports.
9. GCP Observability Tools Comparison
| Tool | Purpose | What it Answers |
|---|---|---|
| Cloud Logging | Log aggregation and analysis | What happened at a specific point in time? |
| Cloud Monitoring | Metrics, dashboards, alerting | Is my service healthy and performing well? |
| Cloud Profiler | Code-level performance analysis | Which function is using the most CPU/memory? |
| Cloud Trace | Distributed tracing | Where is latency in my service calls? |
| Error Reporting | Aggregated error tracking | What bugs are in my code? |
| Cloud Debugger | Live debugging | What is the state of my code at this moment? |
10. Practice Questions
Q1: You need to keep audit logs for 7 years for compliance. Where should you export them?
Answer: Cloud Storage (export via sink) - Cloud Logging only retains 30 days by default.
Q2: You want to query your logs using SQL without exporting to BigQuery. What feature do you use?
Answer: Log Analytics (2026 feature) - allows SQL queries directly on log buckets.
Q3: Which audit log type records when someone reads data from Cloud Storage?
Answer: Data Access audit log (must be manually enabled).